Final Cut Pro. HDV rendering Results.
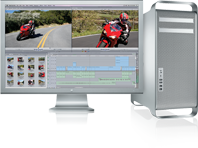
Power Mac G5 Quad G5 2.5GHz
Baseline
Mac Pro 8-core 3.2GHz
1.8x
Up to 1.8x faster than Power Mac G5 Quad
Testing
conducted by Apple in December 2007 using preproduction 8-core 3.2GHz
Mac Pro units and shipping 2.5GHz Power Mac G5 Quad units. All systems
were configured with 4GB of RAM. Performance tests are conducted using
specific computer systems and reflect the approximate performance of
Mac Pro.
Mac Pro Quad-core 2.66GHz
Baseline
Mac Pro 8-core 2.8GHz
1.4x
Up to 1.4x faster with standard 8-core system
Testing
conducted by Apple in December 2007 using preproduction 8-core 2.8GHz
Mac Pro units and shipping quad-core 2.66GHz Mac Pro units. All systems
were configured with 4GB of RAM. Performance tests are conducted using
specific computer systems and reflect the approximate performance of
Mac Pro.
Mac Pro 8-core 3.0GHz
Baseline
Mac Pro 8-core 3.2GHz
1.2x
8-core 3.2GHz Mac Pro performance
Testing
conducted by Apple in December 2007 using preproduction 8-core 3.2GHz
Mac Pro units and shipping 8-core 3.0GHz Mac Pro units. All systems
were configured with 4GB of RAM. Performance tests are conducted using
specific computer systems and reflect the approximate performance of
Mac Pro.
Final Cut Pro. ProRES Rendering.

Mac Pro Quad-core 2.66GHz
Baseline
Mac Pro 8-core 2.8GHz
1.4x
Up to 1.4x faster with standard 8-core system
Testing
conducted by Apple in December 2007 using preproduction 8-core 2.8GHz
Mac Pro units and shipping quad-core 2.66GHz Mac Pro units. All systems
were configured with 4GB of RAM. Performance tests are conducted using
specific computer systems and reflect the approximate performance of
Mac Pro.
Mac Pro 8-core 3.0GHz
Baseline
Mac Pro 8-core 3.2GHz
1.2x
8-core 3.2GHz Mac Pro performance
Testing
conducted by Apple in December 2007 using preproduction 8-core 3.2GHz
Mac Pro units and shipping 8-core 3.0GHz Mac Pro units. All systems
were configured with 4GB of RAM. Performance tests are conducted using
specific computer systems and reflect the approximate performance of
Mac Pro.
Final Cut Studio. HDV Encoding.

Mac Pro Quad-core 2.66GHz
Baseline
Mac Pro 8-core 2.8GHz
1.9x
Up to 2.3x greater with standard 8-core system
Testing
conducted by Apple in December 2007 using preproduction 8-core 2.8GHz
Mac Pro units and shipping quad-core 2.66GHz Mac Pro units. All systems
were configured with 4GB of RAM. Maya test file = Benchmark_Maya.mb
from www.zoorender.com/benchmark. After Effects test file =
nightflight.aep from
http://images.digitalmedianet.com/2005/Week_25/dy0j31w2/story/nightflight.aep.
Photoshop test file size = 400MB. Performance tests are conducted using
specific computer systems and reflect the approximate performance of
Mac Pro.
Mac Pro 8-core 3.0GHz
Baseline
Mac Pro 8-core 3.2GHz
1.1x
8-core 3.2GHz Mac Pro performance
Testing
conducted by Apple in December 2007 using preproduction 8-core 3.2GHz
Mac Pro units and shipping 8-core 3.0GHz Mac Pro units. All systems
were configured with 4GB of RAM. Maya test file = Benchmark_Maya.mb
from www.zoorender.com/benchmark. After Effects test file =
nightflight.aep from
http://images.digitalmedianet.com/2005/Week_25/dy0j31w2/story/nightflight.aep.
Photoshop test file size = 400MB. Performance tests are conducted using
specific computer systems and reflect the approximate performance of
Mac Pro.
Final Cut Studio. ProRES Encoding.

Mac Pro Quad-core 2.66GHz
Baseline
Mac Pro 8-core 2.8GHz
1.3x
Up to 1.3x faster with standard 8-core system
Testing
conducted by Apple in December 2007 using preproduction 8-core 2.8GHz
Mac Pro units and shipping quad-core 2.66GHz Mac Pro units. All systems
were configured with 4GB of RAM. Content was encoded using the
Compressor H.264 for iPod Video 640x480 preset and Qmaster with 8
instances for the 8-core system and 4 instances for the quad-core
system. Performance tests are conducted using specific computer systems
and reflect the approximate performance of Mac Pro.
Mac Pro 8-core 3.0GHz
Baseline
Mac Pro 8-core 3.2GHz
1.1x
8-core 3.2GHz Mac Pro performance
Testing
conducted by Apple in December 2007 using preproduction 8-core 3.2GHz
Mac Pro units and shipping 8-core 3.0GHz Mac Pro units. All systems
were configured with 4GB of RAM. Content was encoded using the
Compressor H.264 for iPod Video 640x480 preset and Qmaster with 8
instances. Performance tests are conducted using specific computer
systems and reflect the approximate performance of Mac Pro.
After Effects CS3. Nightflight benchmark.

Power Mac G5 Quad G5
Baseline
Mac Pro 8-core 3.2GHz
2.8x
Up to 2.8x faster than Power Mac G5 Quad
Testing
conducted by Apple in December 2007 using preproduction 8-core 3.2GHz
Mac Pro units and shipping 2.5GHz Power Mac G5 Quad units. All systems
were configured with 4GB of RAM. After Effects test file =
nightflight.aep from
http://images.digitalmedianet.com/2005/Week_25/dy0j31w2/story/nightflight.aep.
Performance tests are conducted using specific computer systems and
reflect the approximate performance of Mac Pro.
Mac Pro Quad-core 2.66GHz
Baseline
Mac Pro 8-core 2.8GHz
1.9x
Up to 2.3x greater with standard 8-core system
Testing
conducted by Apple in December 2007 using preproduction 8-core 2.8GHz
Mac Pro units and shipping quad-core 2.66GHz Mac Pro units. All systems
were configured with 4GB of RAM. Maya test file = Benchmark_Maya.mb
from www.zoorender.com/benchmark. After Effects test file =
nightflight.aep from
http://images.digitalmedianet.com/2005/Week_25/dy0j31w2/story/nightflight.aep.
Photoshop test file size = 400MB. Performance tests are conducted using
specific computer systems and reflect the approximate performance of
Mac Pro.
Mac Pro 8-core 3.0GHz
Baseline
Mac Pro 8-core 3.2GHz
1.1x
8-core 3.2GHz Mac Pro performance
Testing
conducted by Apple in December 2007 using preproduction 8-core 3.2GHz
Mac Pro units and shipping 8-core 3.0GHz Mac Pro units. All systems
were configured with 4GB of RAM. Maya test file = Benchmark_Maya.mb
from www.zoorender.com/benchmark. After Effects test file =
nightflight.aep from
http://images.digitalmedianet.com/2005/Week_25/dy0j31w2/story/nightflight.aep.
Photoshop test file size = 400MB. Performance tests are conducted using
specific computer systems and reflect the approximate performance of
Mac Pro.
Photoshop CS3. 45-filter function.
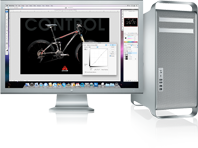
Power Mac G5 Quad G5 2.5GHz
Baseline
Mac Pro 8-core 3.2GHz
1.6x
Up to 1.6x faster than Power Mac G5 Quad
Testing
conducted by Apple in December 2007 using preproduction 8-core 3.2GHz
Mac Pro units and shipping 2.5GHz Power Mac G5 Quad units. All systems
were configured with 4GB of RAM. Photoshop test file size = 400MB.
Performance tests are conducted using specific computer systems and
reflect the approximate performance of Mac Pro.
Mac Pro Quad-core 2.66GHz
Baseline
Mac Pro 8-core 2.8GHz
1.3x
Up to 1.3x faster with standard 8-core system
Testing
conducted by Apple in December 2007 using preproduction 8-core 2.8GHz
Mac Pro units and shipping quad-core 2.66GHz Mac Pro units. All systems
were configured with 4GB of RAM. Photoshop test file size = 400MB.
Performance tests are conducted using specific computer systems and
reflect the approximate performance of Mac Pro.
Mac Pro 8-core 3.0GHz
Baseline
Mac Pro 8-core 3.2GHz
1.2x
8-core 3.2GHz Mac Pro performance
Testing
conducted by Apple in December 2007 using preproduction 8-core 3.2GHz
Mac Pro units and shipping 8-core 3.0GHz Mac Pro units. All systems
were configured with 4GB of RAM. Photoshop test file size = 400MB.
Performance tests are conducted using specific computer systems and
reflect the approximate performance of Mac Pro.
Maya 2008. Mental Ray 3D rendering.
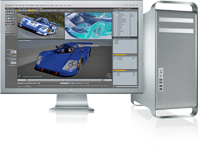
Mac Pro Quad-core 2.66GHz
Baseline
Mac Pro 8-core 2.8GHz
2.1x
Up to 2.1x faster with standard 8-core system
Testing
conducted by Apple in December 2007 using preproduction 8-core 2.8GHz
Mac Pro units and shipping quad-core 2.66GHz Mac Pro units. All systems
were configured with 4GB of RAM. Test file = Benchmark_Maya.mb from
www.zoorender.com/benchmark. Performance tests are conducted using
specific computer systems and reflect the approximate performance of
Mac Pro.
Mac Pro 8-core 3.0GHz
Baseline
Mac Pro 8-core 3.2GHz
1.2x
8-core 3.2GHz Mac Pro performance
Testing
conducted by Apple in December 2007 using preproduction 8-core 3.2GHz
Mac Pro units and shipping 8-core 3.0GHz Mac Pro units. All systems
were configured with 4GB of RAM. Test file = Benchmark_Maya.mb from
www.zoorender.com/benchmark. Performance tests are conducted using
specific computer systems and reflect the approximate performance of
Mac Pro.
Modo 301. 3D rendering.

Power Mac G5 Quad G5
Mac Pro 8-core 3.2GHz
4.0x
Up to 4.0x faster than Power Mac G5 Quad
Testing
conducted by Apple in December 2007 using preproduction 8-core 3.2GHz
Mac Pro units and shipping 2.5GHz Power Mac G5 Quad units. All systems
were configured with 4GB of RAM. Test files = BathFaucet.lxo and
Couch.lxo. Performance tests are conducted using specific computer
systems and reflect the approximate performance of Mac Pro.
Mac Pro Quad-core 2.66GHz
Baseline
Mac Pro 8-core 2.8GHz
2.0x
Up to 2x faster with standard 8-core system
Testing
conducted by Apple in December 2007 using preproduction 8-core 2.8GHz
Mac Pro units and shipping quad-core 2.66GHz Mac Pro units. All systems
were configured with 4GB of RAM. Test files = BathFaucet.lxo and
Couch.lxo. Performance tests are conducted using specific computer
systems and reflect the approximate performance of Mac Pro.
Mac Pro 8-core 3.0GHz
Baseline
Mac Pro 8-core 3.2GHz
1.1x
8-core 3.2GHz Mac Pro performance
Testing
conducted by Apple in December 2007 using preproduction 8-core 3.2GHz
Mac Pro units and shipping 8-core 3.0GHz Mac Pro units. All systems
were configured with 4GB of RAM. Test files = BathFaucet.lxo and
Couch.lxo. Performance tests are conducted using specific computer
systems and reflect the approximate performance of Mac Pro.
Cinebench 10.1. Multiple-processor rendering.

Power Mac G5 Quad G5
Baseline
Mac Pro 8-core 3.2GHz
3.0x
Up to 3.0x faster than Power Mac G5 Quad
Testing
conducted by Apple in December 2007 using preproduction 8-core 3.2GHz
Mac Pro units and shipping 2.5GHz Power Mac G5 Quad units. All systems
were configured with 4GB of RAM. Performance tests are conducted using
specific computer systems and reflect the approximate performance of
Mac Pro.
Mac Pro Quad-core 2.66GHz
Baseline
Mac Pro 8-core 2.8GHz
1.9x
Up to 1.9x faster with standard 8-core system
Testing
conducted by Apple in December 2007 using preproduction 8-core 2.8GHz
Mac Pro units and shipping quad-core 2.66GHz Mac Pro units. All systems
were configured with 4GB of RAM. Performance tests are conducted using
specific computer systems and reflect the approximate performance of
Mac Pro.
Mac Pro 8-core 3.0GHz
Baseline
Mac Pro 8-core 3.2GHz
1.1x
8-core 3.2GHz Mac Pro performance
Testing
conducted by Apple in December 2007 using preproduction 8-core 3.2GHz
Mac Pro units and shipping 8-core 3.0GHz Mac Pro units. All systems
were configured with 4GB of RAM. Performance tests are conducted using
specific computer systems and reflect the approximate performance of
Mac Pro.
Logic Pro 8.0.1. Number of concurrently playing Platinum Verb reverb plug-ins.
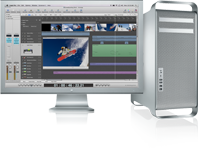
Mac Pro Quad-core 2.66GHz
Baseline
Mac Pro 8-core 2.8GHz
2.3x
Up to 2.3x greater with standard 8-core system
Testing
conducted by Apple in December 2007 using preproduction 8-core 2.8GHz
Mac Pro units and shipping quad-core 2.66GHz Mac Pro units. All systems
were configured with 4GB of RAM. Performance tests are conducted using
specific computer systems and reflect the approximate performance of
Mac Pro.
Mac Pro 8-core 3.0GHz
Baseline
Mac Pro 8-core 3.2GHz
1.2x
8-core 3.2GHz Mac Pro performance
Testing
conducted by Apple in December 2007 using preproduction 8-core 3.2GHz
Mac Pro units and shipping 8-core 3.0GHz Mac Pro units. All systems
were configured with 4GB of RAM. Performance tests are conducted using
specific computer systems and reflect the approximate performance of
Mac Pro.
Logic Pro 8.0.1. Number of concurrently playing Sculpture modeling synths.

Power Mac G5 Quad G5 2.5GHz
Baseline
Mac Pro 8-core 3.2GHz
1.9x
Up to 1.9x greater than Power Mac G5 Quad
Testing
conducted by Apple in December 2007 using preproduction 8-core 3.2GHz
Mac Pro units and shipping 2.5GHz Power Mac G5 Quad units. All systems
were configured with 4GB of RAM. Performance tests are conducted using
specific computer systems and reflect the approximate performance of
Mac Pro.
Mac Pro Quad-core 2.66GHz
Baseline
Mac Pro 8-core 2.8GHz
1.8x
Up to 1.8x greater with standard 8-core system
Testing
conducted by Apple in December 2007 using preproduction 8-core 2.8GHz
Mac Pro units and shipping quad-core 2.66GHz Mac Pro units. All systems
were configured with 4GB of RAM. Performance tests are conducted using
specific computer systems and reflect the approximate performance of
Mac Pro.
Mac Pro 8-core 3.0GHz
Baseline
Mac Pro 8-core 3.2GHz
1.2x
8-core 3.2GHz Mac Pro performance
Testing
conducted by Apple in December 2007 using preproduction 8-core 3.2GHz
Mac Pro units and shipping 8-core 3.0GHz Mac Pro units. All systems
were configured with 4GB of RAM. Performance tests are conducted using
specific computer systems and reflect the approximate performance of
Mac Pro.
OsiriX 2.7.5. Volume and surface render.
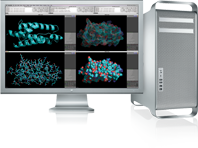
Mac Pro Quad-core 2.66GHz
Baseline
Mac Pro 8-core 2.8GHz
1.2x
Up to 1.2x faster with standard 8-core system
Testing
conducted by Apple in December 2007 using preproduction 8-core 2.8GHz
Mac Pro units and shipping quad-core 2.66GHz Mac Pro units. All systems
were configured with 4GB of RAM. Test file = DICOM sample image set
MANIX. Performance tests are conducted using specific computer systems
and reflect the approximate performance of Mac Pro.
Mac Pro 8-core 3.0GHz
Baseline
Mac Pro 8-core 3.2GHz
1.1x
8-core 3.2GHz Mac Pro performance
Testing
conducted by Apple in December 2007 using preproduction 8-core 3.2GHz
Mac Pro units and shipping 8-Core 3.0GHz Mac Pro units. All systems
were configured with 4GB of RAM. Test file = DICOM sample image set
MANIX. Performance tests are conducted using specific computer systems
and reflect the approximate performance of Mac Pro.
PyMOL 1.0. Wizard Benchmark CPU-based tests.

Power Mac G5 Quad G5 2.5GHz
Baseline
Mac Pro 8-core 3.2GHz
2.1x
Up to 2.1x faster than Power Mac G5 Quad
Testing
conducted by Apple in December 2007 using preproduction 8-core 3.2GHz
Mac Pro units and shipping 2.5GHz Power Mac G5 Quad units. All systems
were configured with 4GB of RAM. PyMOL results are based on ray
trace–based tests from the built-in PyMOL Wizard Benchmark, modified
for 4 threads for the quad-core system and 8 threads for the 8-core
system. Performance tests are conducted using specific computer systems
and reflect the approximate performance of Mac Pro.
Mac Pro Quad-core 2.66GHz
Baseline
Mac Pro 8-core 2.8GHz
1.4x
Up to 1.4x faster with standard 8-core system
Testing
conducted by Apple in December 2007 using preproduction 8-core 2.8GHz
Mac Pro units and shipping quad-core 2.66GHz Mac Pro units. All systems
were configured with 4GB of RAM. PyMOL results are based on ray
trace–based tests from the built-in PyMOL Wizard Benchmark, modified
for 4 threads for the quad-core system and 8 threads for the 8-core
system. Performance tests are conducted using specific computer systems
and reflect the approximate performance of Mac Pro.
Mac Pro 8-core 3.0GHz
Baseline
Mac Pro 8-core 3.2GHz
1.2x
8-core 3.2GHz Mac Pro performance
Testing
conducted by Apple in December 2007 using preproduction 8-core 3.2GHz
Mac Pro units and shipping 8-core 3.0GHz Mac Pro units. All systems
were configured with 4GB of RAM. PyMOL results are based on ray
trace–based tests from the built-in PyMOL Wizard Benchmark, modified
for 4 threads for the quad-core system and 8 threads for the 8-core
system. Performance tests are conducted using specific computer systems
and reflect the approximate performance of Mac Pro.
PyMOL 1.0. Multithread ray trace.

Mac Pro Quad-core 2.66GHz
Baseline
Mac Pro 8-core 2.8GHz
1.4x
Up to 1.9x faster with standard 8-core system
Testing
conducted by Apple in December 2007 using preproduction 8-core 2.8GHz
Mac Pro units and shipping quad-core 2.66GHz Mac Pro units. All systems
were configured with 4GB of RAM. Linpack based on the 1000d Linpack
benchmark available from www.netlib.org/benchmark using a matrix size
of 16,000. PyMOL results are based on ray trace–based tests from the
built-in PyMOL Wizard Benchmark, modified for 4 threads for the
quad-core system and 8 threads for the 8-core system. Xcode results
based on build time of Adium 1.2. Performance tests are conducted using
specific computer systems and reflect the approximate performance of
Mac Pro.
Mac Pro 8-core 3.0GHz
Baseline
Mac Pro 8-core 3.2GHz
1.2x
8-core 3.2GHz Mac Pro performance
Testing
conducted by Apple in December 2007 using preproduction 8-core 3.2GHz
Mac Pro units and shipping 8-core 3.0GHz Mac Pro units. All systems
were configured with 4GB of RAM. Linpack based on the 1000d Linpack
benchmark available from www.netlib.org/benchmark using a matrix size
of 16,000. PyMOL results are based on ray trace–based tests from the
built-in PyMOL Wizard Benchmark, modified for 4 threads for the
quad-core system and 8 threads for the 8-core system. Xcode results
based on build time of Adium 1.2. Performance tests are conducted using
specific computer systems and reflect the approximate performance of
Mac Pro.
Mathematica 6.0.1 Personal Grid Edition. MathematicaMark6.
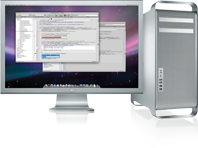
Power Mac G5 Quad G5
Baseline
Mac Pro 8-core 3.2GHz
2.9x
Up to 2.9x faster than Power Mac G5 Quad
Testing
conducted by Apple in December 2007 using preproduction 8-core 3.2GHz
Mac Pro units and shipping 2.5GHz Power Mac G5 Quad units. All systems
were configured with 4GB of RAM. Performance tests are conducted using
specific computer systems and reflect the approximate performance of
Mac Pro.
Mac Pro Quad-core 2.66GHz
Baseline
Mac Pro 8-core 2.8GHz
1.8x
Up to 1.8x faster with standard 8-core system
Testing
conducted by Apple in December 2007 using preproduction 8-core 2.8GHz
Mac Pro units and shipping quad-core 2.66GHz Mac Pro units. All systems
were configured with 4GB of RAM. Performance tests are conducted using
specific computer systems and reflect the approximate performance of
Mac Pro.
Mac Pro 8-core 3.0GHz
Baseline
Mac Pro 8-core 3.2GHz
1.3x
8-core 3.2GHz Mac Pro performance
Testing
conducted by Apple in December 2007 using preproduction 8-core 3.2GHz
Mac Pro units and shipping 8-core 3.0GHz Mac Pro units. All systems
were configured with 4GB of RAM. Performance tests are conducted using
specific computer systems and reflect the approximate performance of
Mac Pro.
Xcode 3.0. Build project.

Power Mac G5 Quad G5
Baseline
Mac Pro 8-core 3.2GHz
2.8x
Up to 2.8x faster than Power Mac G5 Quad
Testing
conducted by Apple in December 2007 using preproduction 8-core 3.2GHz
Mac Pro units and shipping 2.5GHz Power Mac G5 Quad units. All systems
were configured with 4GB of RAM. Results based on build time of Adium
1.2. Performance tests are conducted using specific computer systems
and reflect the approximate performance of Mac Pro.
Mac Pro Quad-core 2.66GHz
Baseline
Mac Pro 8-core 2.8GHz
1.6x
Up to 1.6x faster with standard 8-core system
Testing
conducted by Apple in December 2007 using preproduction 8-core 2.8GHz
Mac Pro units and shipping quad-core 2.66GHz Mac Pro units. All systems
were configured with 4GB of RAM. Results based on build time of Adium
1.2. Performance tests are conducted using specific computer systems
and reflect the approximate performance of Mac Pro.
Quad Xeon 2.66GHz
Baseline
Mac Pro 8-core 3.0GHz
1.2x
8-core 3.2GHz Mac Pro performance
Testing
conducted by Apple in December 2007 using preproduction 8-core 3.2GHz
Mac Pro units and shipping 8-core 3.0GHz Mac Pro units. All systems
were configured with 4GB of RAM. Results based on build time of Adium
1.2. Performance tests are conducted using specific computer systems
and reflect the approximate performance of Mac Pro.


