|
Mac OS X Server’s remote management
tools — specially enhanced for Xserve — let you configure and monitor all
key services through the easy-to-use Aqua interface.
The ultimate early warning system. Xserve extends the power
of Mac OS X Server with Server Monitor, a sophisticated hardware-and-software
monitoring and management tool that gives you in-depth visual feedback on
all your hardware subsystems.
|

|

|

|
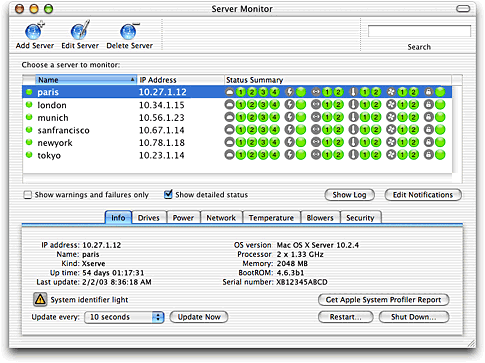
Status Summary. Server Monitor is easy to set up, and lets
you monitor multiple servers using Mac OS X Server’s intuitive Aqua interface.
Red, yellow and green lights indicate the health of your servers (identified
by IP address or DNS name). This nifty support tool lets you drill down into
your hardware subsystems to check the status of each server. Simply select
a server and use the Info, Drives, Power, Network, Temperature, Blowers and
Security tabs to access detailed status and performance information.
Edit Notifications. Send a customized email that alerts specified
individuals when operating conditions exceed predefined thresholds. You can
send short text messages to email-capable pagers, cell phones, or PDAs as
well as full-text details to email clients or full-function PDAs.
Info. Lists key attributes of the server: name, IP address,
device kind, operating system version, processor type, amount of memory,
uptime, last update and hardware serial number. You can also retrieve a detailed
Apple System Profiler report for the selected server or for multiple servers
which can be saved for asset tracking or support logging.
Drives. Shows you the status of the server’s hard drives,
as well as fault and performance SMART data. If Server Monitor finds a problem
or the hard drive predicts a failure, you’ll be notified immediately.
Power. Get the status of your power supply, including historical
line graphs and uninterruptible power supply (UPS) information in an instant.
And in the event of a power failure, Mac OS X Server reboots the machine
and system services — no intervention required.
Network. Shows the status of the two Ethernet links and a
historical line graph for each link.
Temperature. Two thermal sensors (one for the processor card
and one for the enclosure itself) continuously monitor system temperatures,
and give you instant readings in Fahrenheit or Centigrade. You also get historical
line graphs showing spikes and dips in the temperatures of the processor
card and enclosure.
Blowers. One more example of how Server Monitor lets you keep
your finger on the pulse of your hardware subsystems. At what speeds are
the blowers functioning? This tab lets you find out.
Security. Verify the status of the enclosure lock and software
port security. Want to seal off the borders? Consider it done.
Show log. Reveals the log of activities and messages during
the life of each Server Monitor session.
Perhaps best of all, it’s easy to use, easy
to deploy, easy to maintain and service — and, like Xserve itself, designed
to function with minimal downtime.
That’s a huge benefit from the standpoint of slashing your server
maintenance costs, since you won’t have to keep technicians on hand 24/7.
And from a personal standpoint, it offers an equally compelling benefit:
peace of mind. As an administrator, you can rest easy knowing you’ll have
fewer headaches to deal with, you can be more effective and — what a concept
— you can even contemplate taking a well-earned day off now and again.
|

|
|

|
Peace of mind
In addition to Server Monitor, Xserve comes with a special bundled suite of tools from Neon Software. NetMinder Ethernet captures and decodes packet data, quickly pinpointing and alerting you to security issues, conflicts and traffic bottlenecks. LANsurveyor lets you map, troubleshoot and manage your entire network remotely. And CyberGauge monitors network and device utilization with realtime graphs, so you get early warning of security risks and bandwidth limitations via email or pager.
 Uptime, all the time
Mac OS X Server has been designed to ensure maximum uptime. To that end,
it keeps close tabs on all your system services. If one falters or stops
functioning, Mac OS X Server steps in and restarts it automatically.
 Server admin
Remote Server Admin tools let you configure and monitor all key services
of Mac OS X Server — locally or remotely.
SNMP support
Mac OS X Server supports the Simple Network Management Protocol (SNMP),
enabling server monitoring using industry-standard management information
bases (MIBs).
Admin Tools CD
You’ll find everything you need — including server management and monitoring
tools and manuals and documentation in PDF format — on the Admin Tools CD.
 Serial port access
If you prefer using a terminal window, Server Admin provides extensive
command line tools to configure, monitor and manage your systems remotely
using the preinstalled secure shell (SSH). Shell scripts can easily be built
for customer management needs or for periodic automated maintenance. And
if network services are down, Xserve is equipped with a DB-9 (9-pin) serial
port that lets UNIX-savvy administrators access the system through a serial
console session.
 SMART data from hard drives
Monitoring tools continuously sample SMART (Self-Monitoring, Analysis
and Reporting Technology) data from each hard drive to monitor performance
and drive health. If the tools locate a problem (or if the hard drive report
predicts a failure), you’re alerted immediately.
|